Week 9: US chaos, Tech's Pandora's box, Bitcoin whales, Strong economy, Record FII inflows vs. negative editorials

The world watched the ongoing chaos in American politics with a mix of shock and humour. Is the reality TV show that is/was Trump’s political career over, or was this just a cliffhanger before the next season starts? Who knows. But amidst the chaos, the reality is that the Democrats now control the Presidency, the Congress and the Senate. The “Blue Wave” happened. That is far more important for policy, economics and markets going forward than Trump’s theatrics. The Democrats are promising “bold change”: $2000 stimulus cheques, infrastructure spending and climate action. So far so good for markets. Who is going to pay for all this? Joe Biden’s tax proposals will now be in the spotlight:
raising the marginal income tax rate from 37% to 39.6% for those making more than $400,000;
raising corporate taxes from 21% to 28%;
taxing long-term capital gains and qualified dividends at the ordinary income tax rate of 39.6 percent on income above $1 million;
those making over $400,000 subject to an additional 12.4% Social Security payroll tax, split evenly between employers and employees
Markets haven’t reacted adversely to this (yet). But corporate taxes going up will mathematically reduce earnings for corporate America (Bank of America estimates 7% lower earnings for the S&P500), which will either lead to lower share prices or more expensive P/E multiples. Let’s see.
Twitter and Facebook closed Trump’s accounts, and simultaneously opened a Pandora’s box. As they say, when you can silence the King, you are the King. Facebook and Zuckerberg have come a long way from their origins of creating a website to rate the hotness of girls on the Harvard campus. More seriously, what happens if next time, these dominant platforms deactivate the account of a head of state of a foreign country?
Bitcoin has gone parabolic (again). The chart below maps Bitcoin against some bubbles of the 20th/21st Centuries. No comparison. I don’t know if Bitcoin is a bubble or something more sustainable, but I did see an interesting article this week, which claims that 95% of Bitcoin is owned by 2% of accounts. It seem 70% of Bitcoin “addresses” have less than 0.01 Bitcoin in them. Further, it seems that as the recent rally has taken off in recent weeks, the concentration in the hands of a few “Bitcoin whales” has increased.

As I mentioned last week, demand on the ground is very strong in India. The December quarter corporate India earnings will surprise people (at least those who are confounded by the market’s upward move). From anecdotal evidence, building products, autos, metals, tech (among others) are buzzing. Let’s hope the momentum continues. If it does, then the March, June and September quarters will be explosive; because (1) year on year comparables will be easy (i.e. the lows of lockdown quarters previous year), and (2) hopefully the vaccine roll-out will go smoothly and beaten-down travel and other related sectors will come back with a vengeance (how desperate is everyone for a holiday or to go to their favourite restaurants?!). Maybe the long awaited earnings recovery cycle has started.
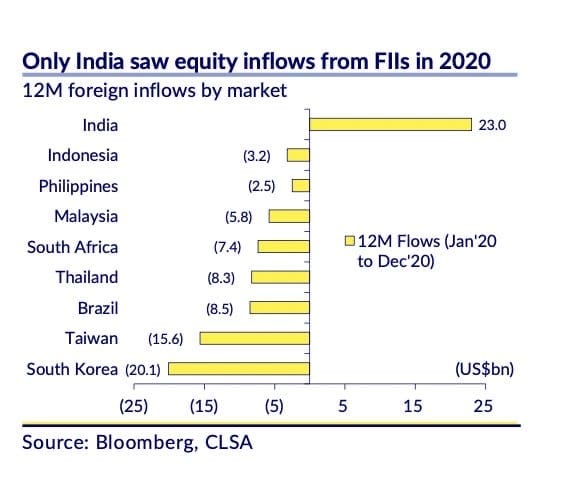
Speaking of corporate India, check out the graph from CLSA below. Not only did India receive $23bn of net FII inflows, it was the only major emerging market to get positive FII flows in 2020. This was the second year in a row when FII inflows into Indian equities were highest among emerging markets. The capital allocators abroad seem to disagree with their journalist counter-parts. In the last two years when India got these record inflows, we were also treated to the below headlines:
Intolerant India: Narendra Modi stokes divisions in the world’s biggest democracy. Economist Jan 2020. Too many to choose from by the Economist.
Why I’m Losing Hope in India: Bloomberg November 2020.
Modi’s Legacy May Be Instability and Stagnation. Wall Street Journal December 2019
I tried to search for articles on India in the Financial Times, and they mostly all have a negative bent. In fact, the only out and out positive article that I found in the FT on India was this: Stars of India: the best chutneys and pickles for Diwali


Referring to point 3. The graph inaccurately shows bitcoin "bubble" starting from 2019. However, the redline should start in 2009. Which bubble lasted 12 years and counting? Also, a logarithmic chart would be more useful, as there were many "bubbles" in bitcoin after every halving, resulting in an 80% correction to a yet higher price than before. You can't see that in a linear chart. The question one has to ask after 12 years is, HOW would a new and from the properties superior (1) store of value, which possibly is resulting in a medium of exchange (2) at some later point develop over a 12 year horizon? With a 600 billion market cap, maybe it's time to amuse the possibility that when enough people believe in something has a store of value, it indeed becomes a store of value e.g. gold.